

Using Python in Power BI
In the former blog post we set up the virtual environment for Python in Power BI. In this post, I will show you how to use Python in Power BI.
To check
Be sure to activate the virtual environment in a command prompt, I’m using powerbienv in the examples as set up in the former blog post. If you haven’t yet install the packages numpy, pandas and matplotlib by typing pip install numpy pandas matplotlib. This will install the packages in the virtual environment. We will need these packages to manipulate and visualize data in Power BI.
Create a new report
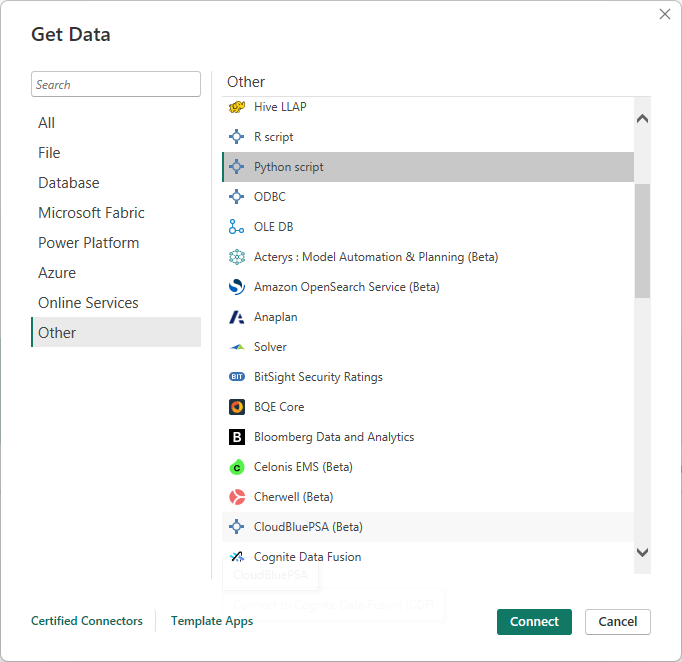
After creating a new reportin Power BI, check if the virtual environment is set up correctly as per the former blog post. If so select Get datasource > More... > Other > Python script and click Connect.
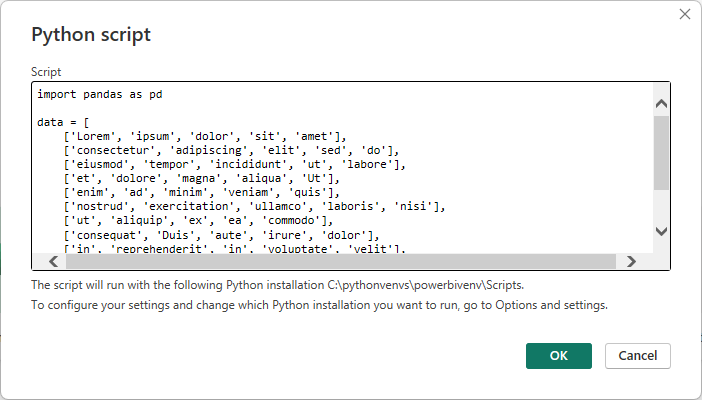
Then provide some snippet of Python code and click OK.
I used the following sample code based on Lorem Ipsum text:
import pandas as pd

data = [
    ['Lorem', 'ipsum', 'dolor', 'sit', 'amet'],
    ['consectetur', 'adipiscing', 'elit', 'sed', 'do'],
    ['eiusmod', 'tempor', 'incididunt', 'ut', 'labore'],
    ['et', 'dolore', 'magna', 'aliqua', 'Ut'],
    ['enim', 'ad', 'minim', 'veniam', 'quis'],
    ['nostrud', 'exercitation', 'ullamco', 'laboris', 'nisi'],
    ['ut', 'aliquip', 'ex', 'ea', 'commodo'],
    ['consequat', 'Duis', 'aute', 'irure', 'dolor'],
    ['in', 'reprehenderit', 'in', 'voluptate', 'velit'],
    ['esse', 'cillum', 'dolore', 'eu', 'fugiat']
]

df = pd.DataFrame(data, columns=['Column 1', 'Column 2', 'Column 3', 'Column 4', 'Column 5'])
Press OK and the navigator will appear. Here you can select the data you want to import.
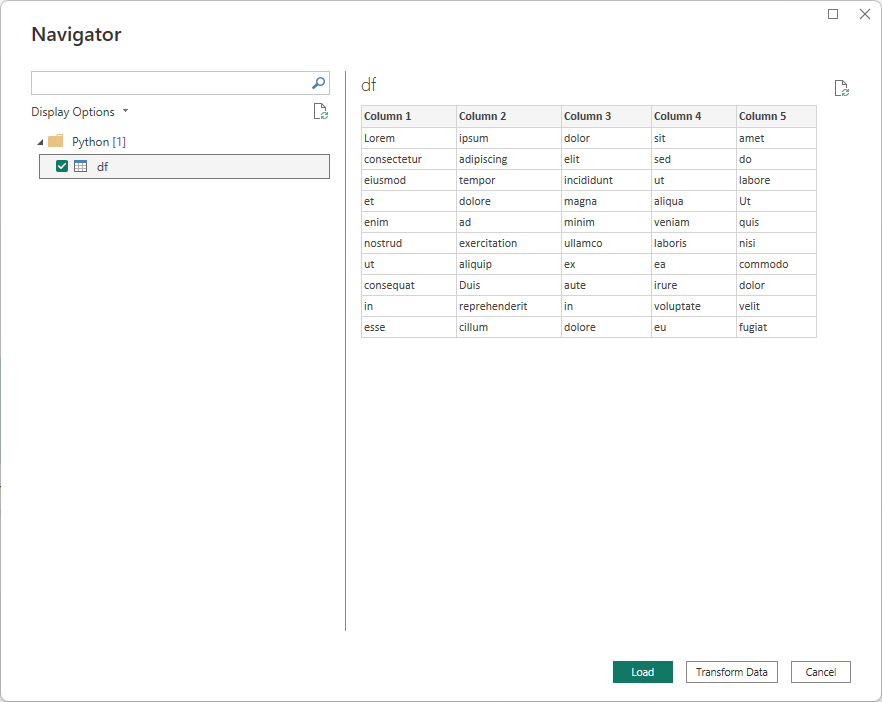
Press the Transform Data button.
After you followed all the steps you can open the Advanced Editor and see the Python script that was generated. You can now use Python to manipulate and visualize your data in Power BI.
let
    Source = Python.Execute("import pandas as pd#(lf)#(lf)data = [#(lf)    ['Lorem', 'ipsum', 'dolor', 'sit', 'amet'],#(lf)    ['consectetur', 'adipiscing', 'elit', 'sed', 'do'],#(lf)    ['eiusmod', 'tempor', 'incididunt', 'ut', 'labore'],#(lf)    ['et', 'dolore', 'magna', 'aliqua', 'Ut'],#(lf)    ['enim', 'ad', 'minim', 'veniam', 'quis'],#(lf)    ['nostrud', 'exercitation', 'ullamco', 'laboris', 'nisi'],#(lf)    ['ut', 'aliquip', 'ex', 'ea', 'commodo'],#(lf)    ['consequat', 'Duis', 'aute', 'irure', 'dolor'],#(lf)    ['in', 'reprehenderit', 'in', 'voluptate', 'velit'],#(lf)    ['esse', 'cillum', 'dolore', 'eu', 'fugiat']#(lf)]#(lf)#(lf)df = pd.DataFrame(data, columns=['Column 1', 'Column 2', 'Column 3', 'Column 4', 'Column 5'])"),
    df1 = Source{[Name="df"]}[Value],
    #"Changed Type" = Table.TransformColumnTypes(df1,{{"Column 1", type text}, {"Column 2", type text}, {"Column 3", type text}, {"Column 4", type text}, {"Column 5", type text}})
in
    #"Changed Type"
You can now press the Close & Apply button and use the data in your reports just like any other data source.
Leave a Comment